 Last:
Last: 
Jakarta, GIC Trade – The Australian dollar currency got negative sentiment from the escalating tensions between the United States (US) and China after the balloon event.
U.S. President Joe Biden ordered the Pentagon to shoot down a Chinese spy balloon, which has been recognized as a civilian by Chinese authorities positioned as a meteorological necessity, has resulted in discomfort between the two countries.
The negative sentiment is because Australia is China's main trading partner and geopolitical tensions between the US and China can have a significant impact on the movement of the Australian dollar.
Rising geopolitical tensions and rising expectations of further interest rate hike measures by the Federal Reserve after a much better-than-expected employment data report gave the aussie a bearish bias.
Nevertheless, the Australian dollar can provide volatile price movements ahead of the interest rate decision by the Reserve Bank of Australia (RBA). The RBA's decision is scheduled for February 8, 2023 and RBA Governor Philip Lowe is expected to extend the Official Cash rae (OCR) further to dampen the pace of inflation.
Analysts at Deutsche Bank Australia see that the RBA is likely to push the official interest rate (OCR) to 4.1% which is currently at 3.1% after seeing a CPI increase of 7.8%.
Fundamentally, geopolitical tensions between the US and China put pressure on the Australian dollar to weaken. However, the RBA's policy of being more aggressive in raising interest rates could prop up the aussie to move for a rebound. Then how technically, see the following analysis:
Technical Analysis
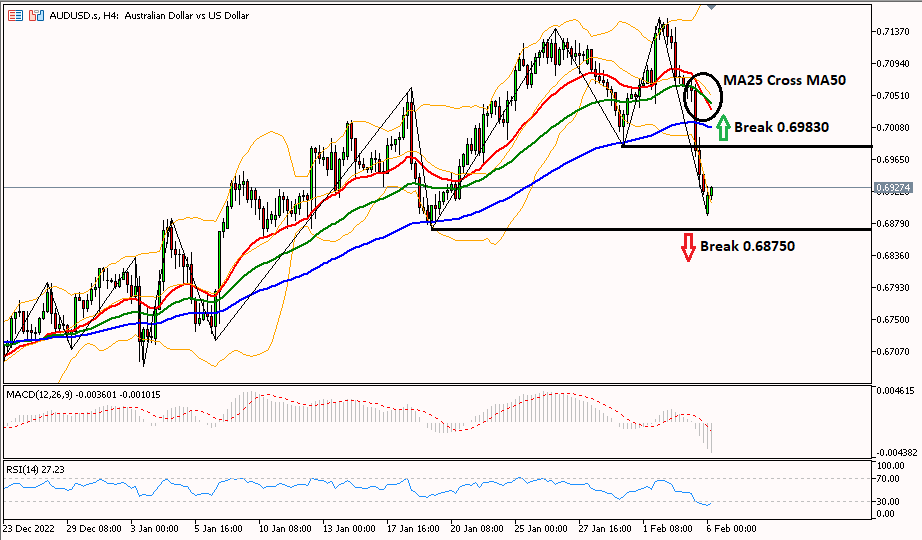
AUD/USD in the 4-hour period is trying to rebound, which is marked by the RSI indicator which is already in the oversold area. To change the bias to bullish, it is necessary to break the level of 0.69830 to test the resistance of 0.70800. However, to resume the downtrend, it is necessary to cross the support at 0.68750 towards the next support at 0.68380.
While the MA 25 line crossing the MA50 line indicates a further decline, while the chart that is still below the MA100 line is also a downtrend parameter.
This Forex Trading Analysis is a fundamental and technical view used by the author, not a suggestion or a solicitation. To get more information click on the image below.


