Last:
Last: 
The following is a technical daily analysis, May 8, 2023. The data and analysis contained in this newsletter can be used on a wide scale for your trading. However, it is important to note that GICTrade and its data providers are not responsible for your trading results.
So, it's your own responsibility. Before knowing today's technical analysis, immediately register yourself to take part in the GIC Gebyar Prize and get the main prize, namely Mobile Mitshubshi Expander or Vacation Package to Labuan Bajo for 4 days and 3 nights.
In the following, we will inform you about the forecast of price movements in Forex and Commodities which is equipped with the calculation of Pivot points, Resistance and Support levels.
EURUSD
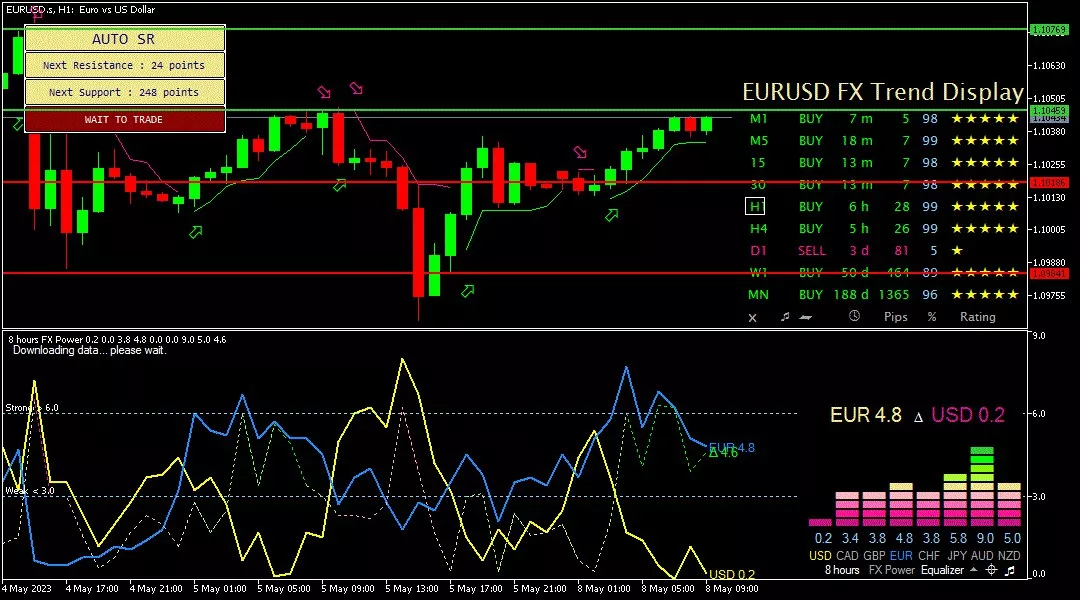
EUR/USD on the 1-hour period tried to move upwards touching the resistance level at 1.10540 until heading to the next resistance level at 1.10910. The upward trend can also be seen from the FXBot template, where the EUR figure is still higher at 4.8 than the USD figure of 0.2. Meanwhile, the bullish trend is also supported by a buy signal indicated by a green arrow.
Suggest: Buy 1.10540 TP1 1.10910 TP2 1.11350 SL 1.10100
|
PREVIOUS RANGE |
||||||
|
OPEN |
HIGH |
LOW |
CLOSE |
PREV.CLOSE |
CHANGE |
%CHANGE |
|
1.10104 |
1.10471 |
1.09661 |
1.10165 |
1.10115 |
0.00050 |
0.05% |
|
DAILY PIVOT POINT |
||||||
|
R3 |
R2 |
R1 |
PIVOT |
S1 |
S2 |
S3 |
|
1.11350 |
1.10910 |
1.10540 |
1.10100 |
1.09730 |
1.09290 |
1.08920 |
GBPUSD
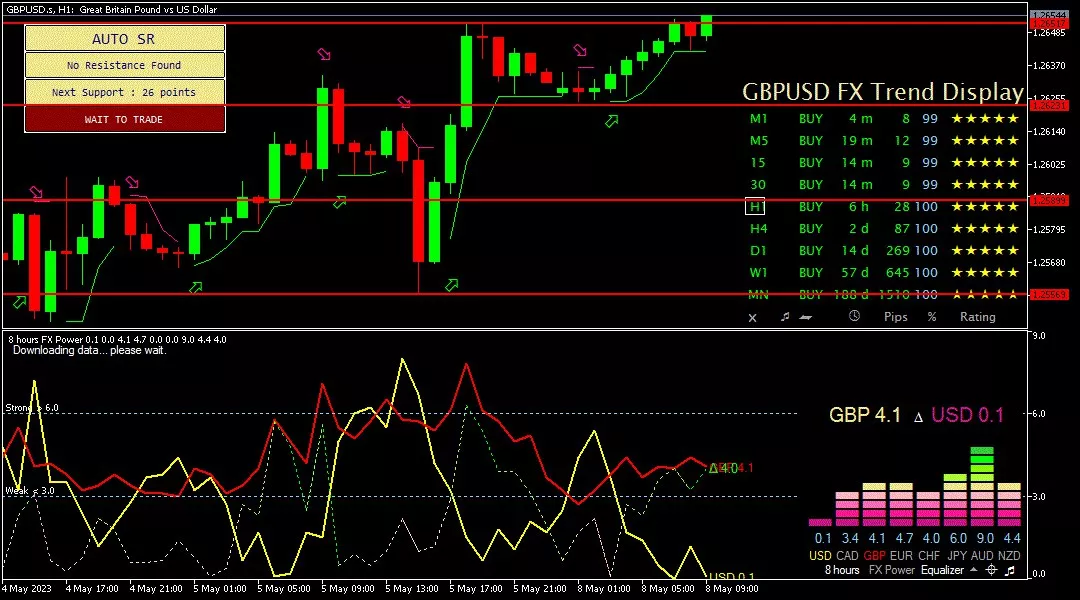
GBP/USD on the 1-hour period tried to move upwards touching the resistance level at 1.26900 until heading towards the next resistance level at 1.27430. The upward trend can also be seen from the FXBot template, where the GBP figure is higher by 4.1 than the USD figure of 0.1. While the bullish bias is also supported by a buy signal indicated by a green arrow.
Suggest: Buy 1.26900 TP1 1.27430 TP2 1.27700 SL 1.26490
|
PREVIOUS RANGE |
||||||
|
OPEN |
HIGH |
LOW |
CLOSE |
PREV.CLOSE |
CHANGE |
%CHANGE |
|
1.25715 |
1.26517 |
1.25573 |
1.26309 |
1.25715 |
0.00594 |
0.47% |
|
DAILY PIVOT POINT |
||||||
|
R3 |
R2 |
R1 |
PIVOT |
S1 |
S2 |
S3 |
|
1.27430 |
1.26970 |
1.26490 |
1.26030 |
1.25540 |
1.25090 |
1.24600 |
AUDUSD
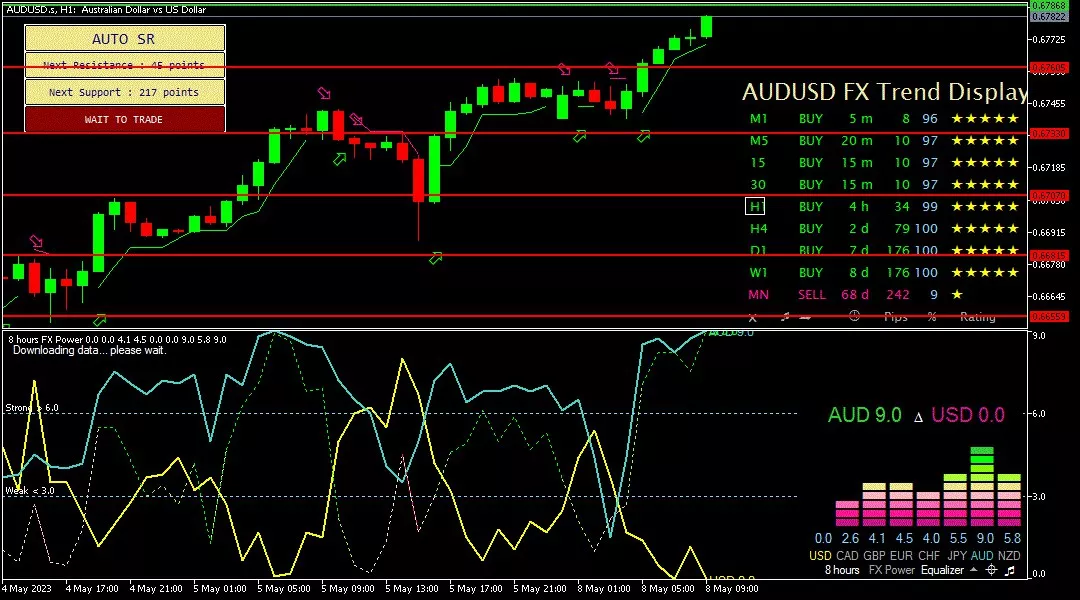
AUD/USD on the 1-hour period tried to move further upwards, touching the resistance level at 0.67900 until heading towards the next resistance level at 0.68240. The upward trend can also be seen from the FXBot template, where the AUD figure is higher by 9.0 than the USD figure of 0.0. While the bullish bias is also supported by a buy signal indicated by a green arrow.
Suggest: Buy 0.67900 TP1 0.68240 TP2 0.68500 SL 0.67560
|
PREVIOUS RANGE |
||||||
|
OPEN |
HIGH |
LOW |
CLOSE |
PREV.CLOSE |
CHANGE |
%CHANGE |
|
0.66923 |
0.67562 |
0.66881 |
0.67513 |
0.66925 |
0.00594 |
0.88% |
|
DAILY PIVOT POINT |
||||||
|
R3 |
R2 |
R1 |
PIVOT |
S1 |
S2 |
S3 |
|
0.68240 |
0.67900 |
0.67560 |
0.67220 |
0.66880 |
0.66540 |
0.66200 |
USDCHF
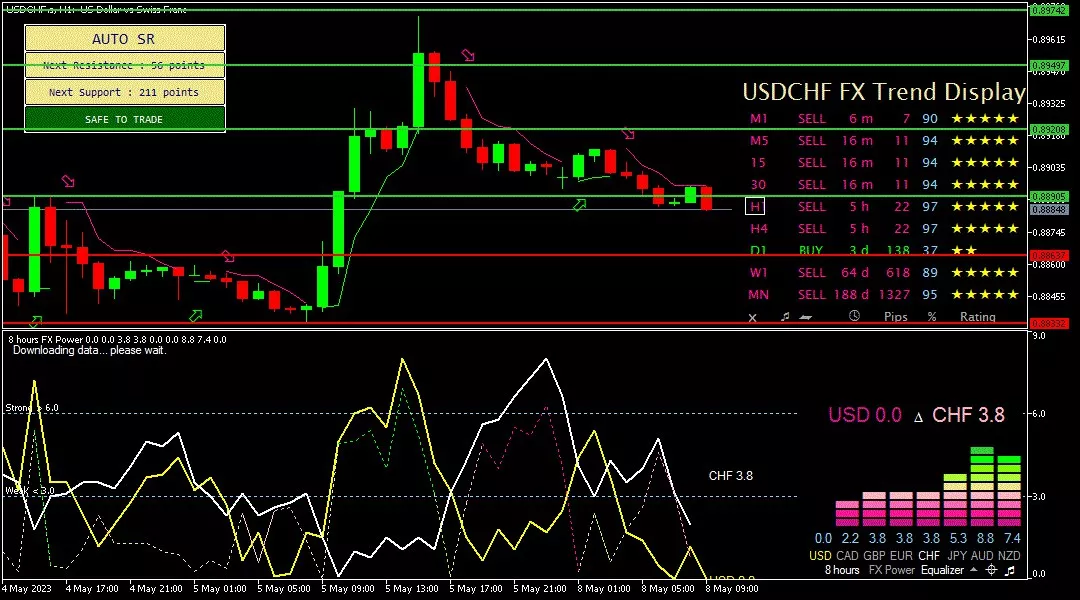
USD/CHF on the 1-hour period is trying to move further down, needing to break through the support level at 0.88500 and towards the next support level at 0.88120. The downward trend can also be seen from the FXBot template, where the CHF figure is higher by 3.8 from the USD figure of 0.0. While the bearish bias is also supported by a sell signal indicated by a red arrow.
Suggest: Sell 0.88500 TP1 0.88120 TP2 0.87850 SL 0.88900
|
PREVIOUS RANGE |
||||||
|
OPEN |
HIGH |
LOW |
CLOSE |
PREV.CLOSE |
CHANGE |
%CHANGE |
|
0.88583 |
0.89718 |
0.88337 |
0.89040 |
0.88583 |
0.00457 |
0.52% |
|
DAILY PIVOT POINT |
||||||
|
R3 |
R2 |
R1 |
PIVOT |
S1 |
S2 |
S3 |
|
0.90880 |
0.90300 |
0.89500 |
0.88920 |
0.88120 |
0.87540 |
0.86740 |
USDJPY
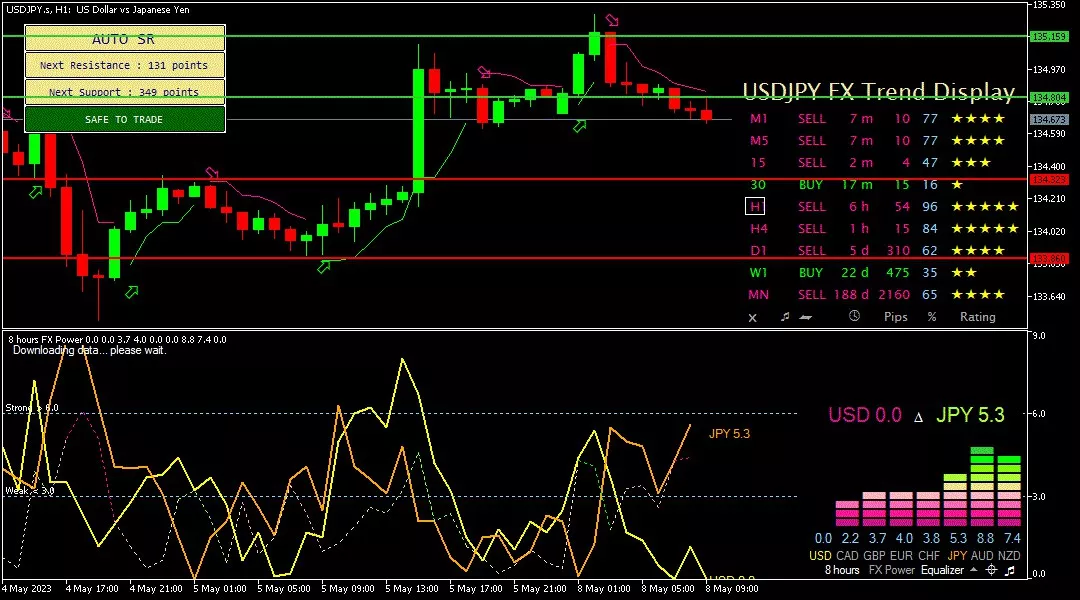
USD/JPY on the 1-hour period is trying to move down, further need to break through the support level at 134,520 to reach the next support level at 133,920. The downward trend can also be seen from the FXBot template, where the JPY figure is higher by 5.3 than the USD figure of 0.0. While the bearish trend is also supported by sell signals indicated by red arrows.
Suggest: Sell 14.520 TP1 133.920 TP2 133.700 SL 134.850
|
PREVIOUS RANGE |
||||||
|
OPEN |
HIGH |
LOW |
CLOSE |
PREV.CLOSE |
CHANGE |
%CHANGE |
|
134.260 |
135.116 |
133.879 |
134.809 |
134.272 |
0.537 |
0.40% |
|
DAILY PIVOT POINT |
||||||
|
R3 |
R2 |
R1 |
PIVOT |
S1 |
S2 |
S3 |
|
136.400 |
135.760 |
135.160 |
134.520 |
133.920 |
133.280 |
132.690 |
XUL (LOCO LONDON GOLD)

Gold prices in the 1-hour period tried to move up, touching the resistance area of 2025.00 until heading to the next resistance level at 2050.00. Meanwhile, the bullish trend is also supported by a buy signal indicated by a green arrow.
Suggest: Buy 2025.00 TP1 2032.00 TP2 2040.00 SL 2015.00
|
PREVIOUS RANGE |
||||||
|
OPEN |
HIGH |
LOW |
CLOSE |
PREV.CLOSE |
CHANGE |
%CHANGE |
|
2049.49 |
2052.81 |
1999.37 |
2017.58 |
2050.53 |
-32.95 |
-1.61% |
|
DAILY PIVOT POINT |
||||||
|
R3 |
R2 |
R1 |
PIVOT |
S1 |
S2 |
S3 |
|
2113.70 |
2083.20 |
2060.20 |
2029.80 |
2006.80 |
1976.40 |
1953.40 |
CLSK (OIL)

Oil prices in the 1-hour period tried to move up, testing the resistance area at 72.31 until heading to the next resistance level at 73.83. Meanwhile, to fall further, oil prices need to pass the support level at 70.86 to reach the next support level at 69.26.
Suggest: Buy 72.31 TP1 73.00 TP2 73.83 SL 71.50
|
PREVIOUS RANGE |
||||||
|
OPEN |
HIGH |
LOW |
CLOSE |
PREV.CLOSE |
CHANGE |
%CHANGE |
|
68.68 |
71.78 |
68.47 |
71.31 |
68.56 |
2.75 |
4.01% |
|
DAILY PIVOT POINT |
||||||
|
R3 |
R2 |
R1 |
PIVOT |
S1 |
S2 |
S3 |
|
75.88 |
73.83 |
72.57 |
70.52 |
69.26 |
67.21 |
65.95 |
So, that's the explanation of "Technical Daily Analysis: May 8, 2023 – Safe Haven Plummets, Risky Assets to Be Hunted".