Last:
Last: 
The following is a technical daily analysis, May 4, 2023. The data and analysis contained in this newsletter can be used on a wide scale for your trading. However, it is important to note that GICTrade and its data providers are not responsible for your trading results.
So, it's your own responsibility. Before knowing today's technical analysis, immediately register yourself to take part in the GIC Gebyar Prize and get the main prize, namely Mobile Mitshubshi Expander or Vacation Package to Labuan Bajo for 4 days and 3 nights.
In the following, we will inform you about the forecast of price movements in Forex and Commodities which is equipped with the calculation of Pivot points, Resistance and Support levels.
EURUSD
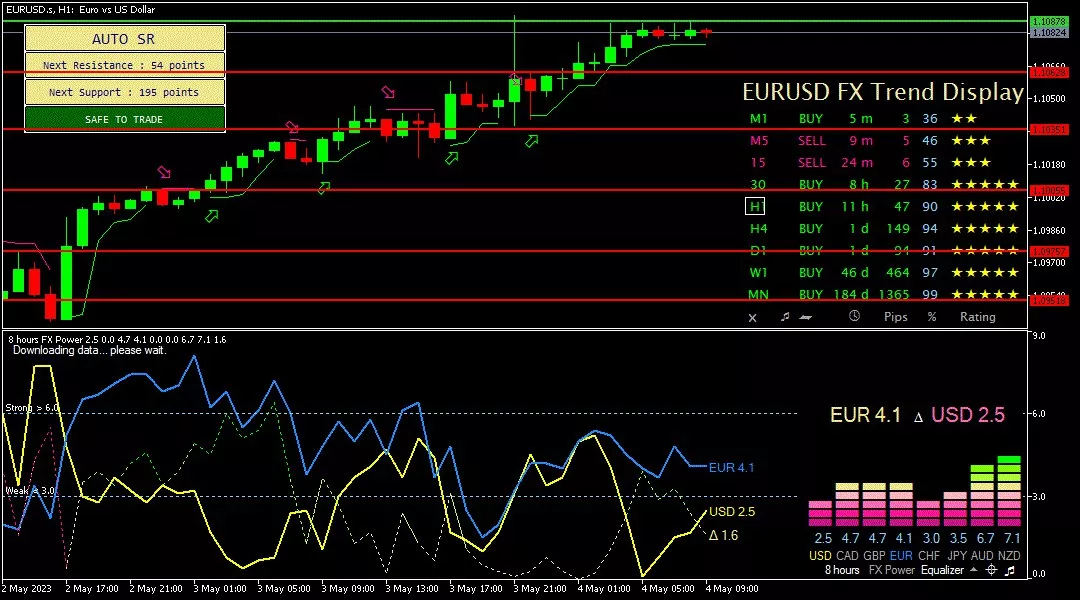
EUR/USD on the 1-hour period rose further, trying to touch the resistance level at 1.11000 until the next resistance level at 1.11310. However, the uptrend is still quite weak as seen from the FXBot template, where the EUR figure is slightly higher by 4.1 than the USD figure of 2.5. Meanwhile, the bullish trend is also supported by a buy signal indicated by a green arrow.
Suggest: Buy 1.11000 TP1 1.11310 TP2 1.11710 SL 1.10770
|
PREVIOUS RANGE |
||||||
|
OPEN |
HIGH |
LOW |
CLOSE |
PREV.CLOSE |
CHANGE |
%CHANGE |
|
1.09985 |
1.10907 |
1.09966 |
1.10610 |
1.09985 |
0.00625 |
0.57% |
|
DAILY PIVOT POINT |
||||||
|
R3 |
R2 |
R1 |
PIVOT |
S1 |
S2 |
S3 |
|
1.11710 |
1.11310 |
1.10770 |
1.10370 |
1.09830 |
1.09430 |
1.08890 |
GBPUSD
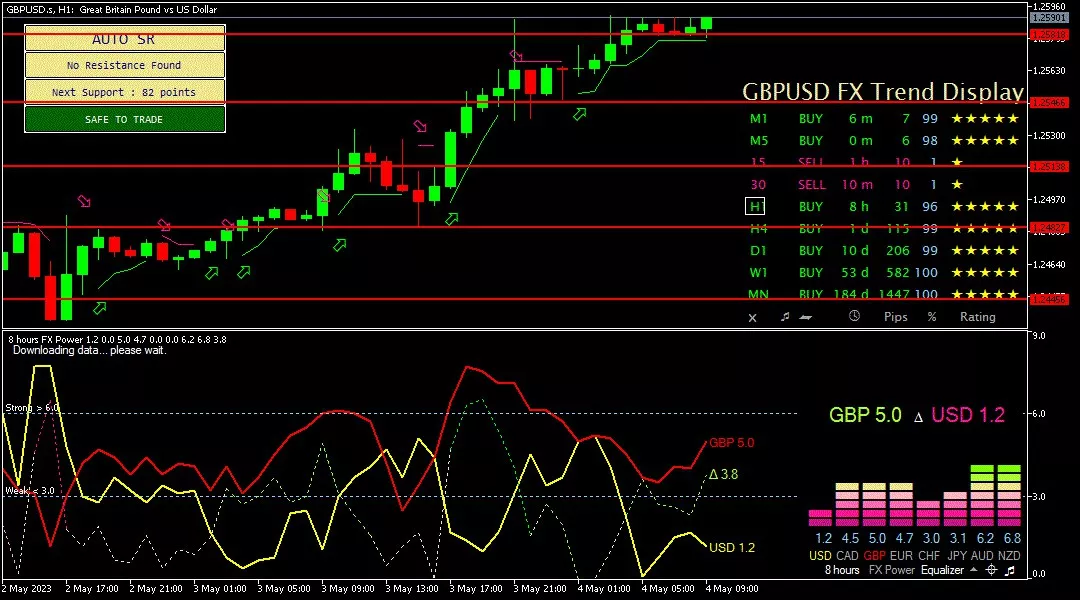
GBP/USD on the 1-hour period tried to move upwards touching the resistance level at 1.26000 until heading towards the next resistance level at 1.26480. The upward trend can also be seen from the FXBot template, where the GBP figure is higher by 5.0 than the USD figure of 1.2. While the bullish bias is also supported by a buy signal indicated by a green arrow.
Suggest: Buy 1.26000 TP1 1.26480 TP2 1.26750 SL 1.25700
|
PREVIOUS RANGE |
||||||
|
OPEN |
HIGH |
LOW |
CLOSE |
PREV.CLOSE |
CHANGE |
%CHANGE |
|
1.24666 |
1.25893 |
1.24611 |
1.25643 |
1.24666 |
0.00977 |
0.79% |
|
DAILY PIVOT POINT |
||||||
|
R3 |
R2 |
R1 |
PIVOT |
S1 |
S2 |
S3 |
|
1.27070 |
1.26480 |
1.25790 |
1.25200 |
1.24510 |
1.23920 |
1.23230 |
AUDUSD
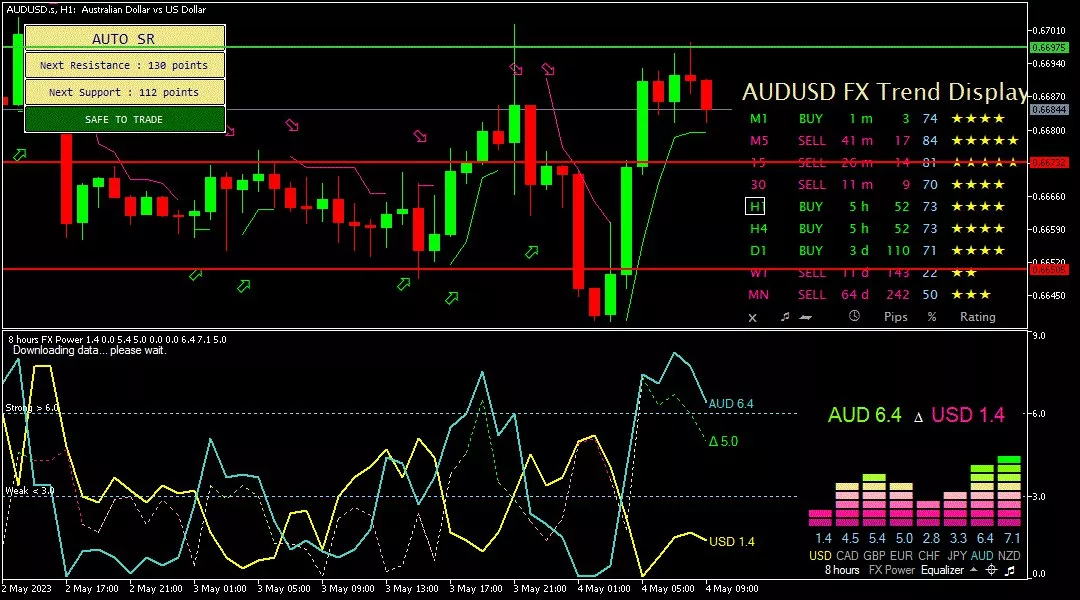
AUD/USD on the 1-hour period tried to move upwards touching the resistance level at 0.66940 until heading towards the next resistance level at 0.67240. The upward trend can also be seen from the FXBot template, where the AUD figure is higher by 6.4 than the USD figure of 1.4.
Suggest: Sell 0.66570 TP1 0.65980 TP2 0.66600 SL 0.66940
|
PREVIOUS RANGE |
||||||
|
OPEN |
HIGH |
LOW |
CLOSE |
PREV.CLOSE |
CHANGE |
%CHANGE |
|
0.66620 |
0.67024 |
0.66485 |
0.66722 |
0.66620 |
0.00102 |
0.15% |
|
DAILY PIVOT POINT |
||||||
|
R3 |
R2 |
R1 |
PIVOT |
S1 |
S2 |
S3 |
|
0.67470 |
0.67250 |
0.66940 |
0.66710 |
0.66400 |
0.66170 |
0.65860 |
USDCHF
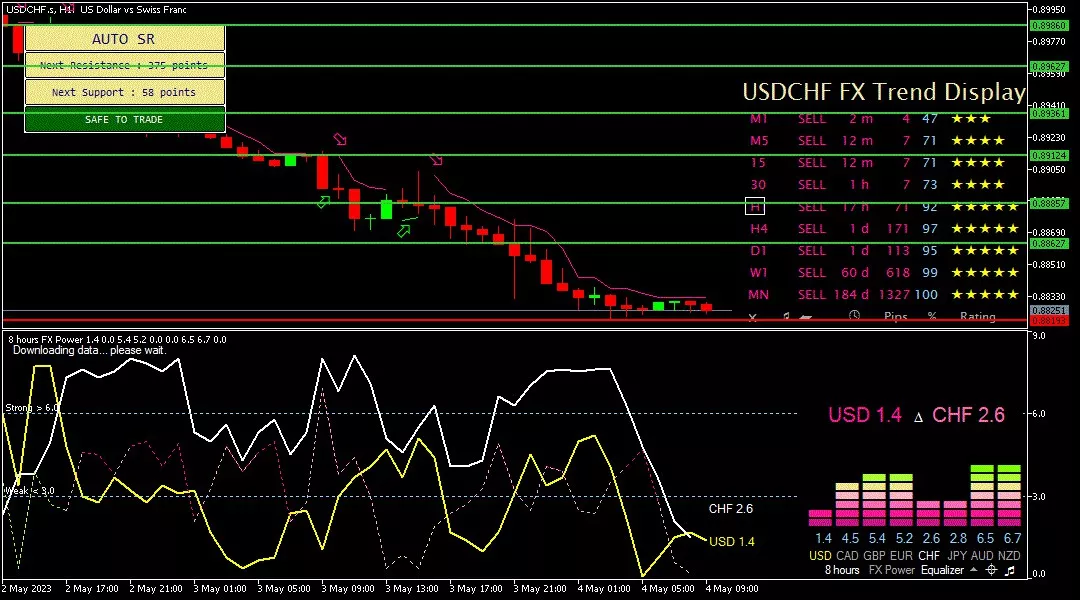
USD/CHF on the 1-hour period is trying to move further down, needing to cross the support level at 0.88000 to the next support level at 0.87800. The downward trend can also be seen from the FXBot template, where the CHF figure is higher by 2.6 than the USD figure of 1.4. While the bearish bias is also supported by a sell signal indicated by a red arrow.
Suggest: Sell 0.88000 TP1 0.87800 TP2 0.87600 SL 0.88300
|
PREVIOUS RANGE |
||||||
|
OPEN |
HIGH |
LOW |
CLOSE |
PREV.CLOSE |
CHANGE |
%CHANGE |
|
0.89320 |
0.89320 |
0.88321 |
0.88406 |
0.89320 |
-0.00914 |
-1.02% |
|
DAILY PIVOT POINT |
||||||
|
R3 |
R2 |
R1 |
PIVOT |
S1 |
S2 |
S3 |
|
0.90360 |
0.89840 |
0.89360 |
0.88840 |
0.88360 |
0.87840 |
0.87360 |
USDJPY
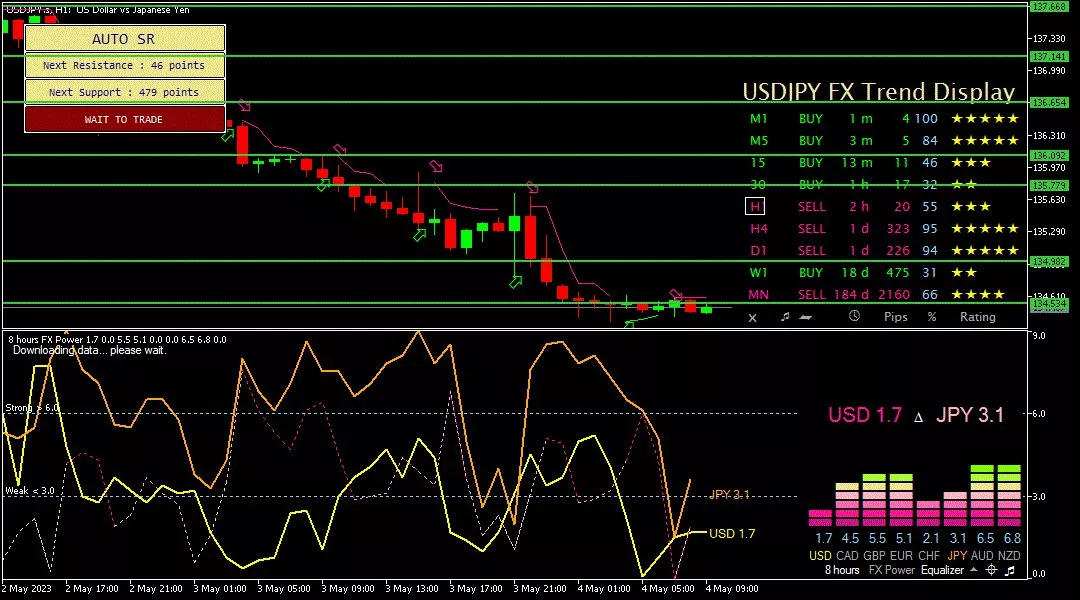
USD/JPY in the 1-hour period is trying to move down, needing to break through the support level at 134,000 to the next support level at 133,700. The downward trend can also be seen from the FXBot template, where the JPY figure is higher by 3.1 from the USD figure of 1.7. While the bearish trend is also supported by sell signals indicated by red arrows.
Suggest: Sell 134.000 TP1 133.700 TP2 133.500 SL 134.300
|
PREVIOUS RANGE |
||||||
|
OPEN |
HIGH |
LOW |
CLOSE |
PREV.CLOSE |
CHANGE |
%CHANGE |
|
136.546 |
136.597 |
134.724 |
134.766 |
136.551 |
-1.785 |
-1.30% |
|
DAILY PIVOT POINT |
||||||
|
R3 |
R2 |
R1 |
PIVOT |
S1 |
S2 |
S3 |
|
138.470 |
137.530 |
136.600 |
135.660 |
134.720 |
133.790 |
132.850 |
XUL (LOCO LONDON GOLD)
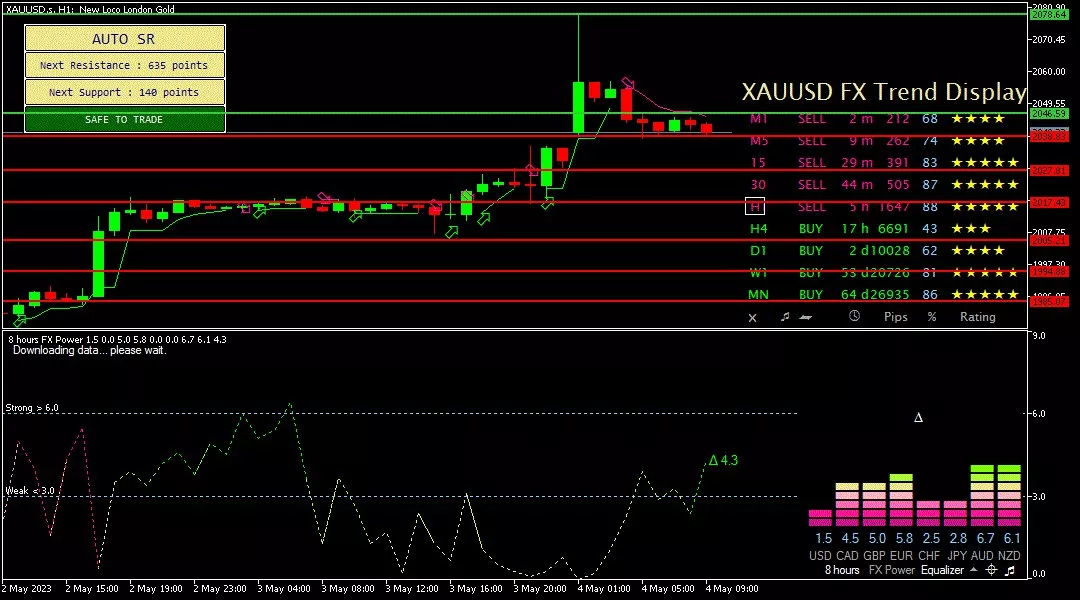
Gold prices in the 1-hour period tried to move down, touching the 2035.00 support area until heading to the next support level at 2025.00. While the bearish trend is also supported by sell signals indicated by red arrows.
Suggest: Sell 2035.00 TP1 2030.00 TP2 2025.00 SL 2045.00
|
PREVIOUS RANGE |
||||||
|
OPEN |
HIGH |
LOW |
CLOSE |
PREV.CLOSE |
CHANGE |
%CHANGE |
|
2016.28 |
2035.80 |
2007.50 |
2031.03 |
2016.05 |
14.98 |
0.74% |
|
DAILY PIVOT POINT |
||||||
|
R3 |
R2 |
R1 |
PIVOT |
S1 |
S2 |
S3 |
|
2066.20 |
2051.00 |
2037.90 |
2022.70 |
2009.60 |
1994.40 |
1981.30 |
CLSK (OIL)
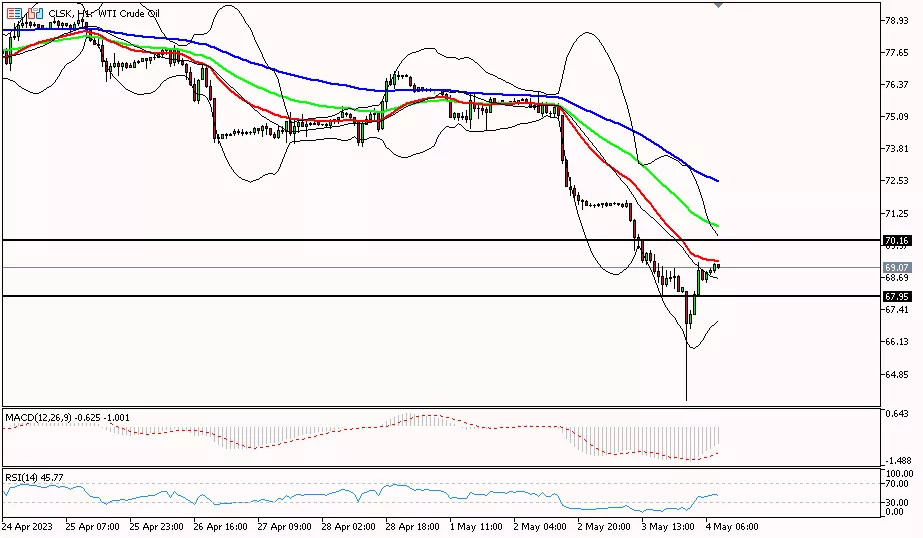
Oil prices in the 4-hour period tried to move up, testing the resistance area at 70.16 until heading to the next resistance level at 70.71. Meanwhile, to fall further, oil prices need to pass the support level at 67.95 again to the next support level at 66.90.
Suggest: Buy 70.16 TP1 70.71 TP2 72.50 SL 69.33
|
PREVIOUS RANGE |
||||||
|
OPEN |
HIGH |
LOW |
CLOSE |
PREV.CLOSE |
CHANGE |
%CHANGE |
|
71.54 |
71.76 |
67.95 |
68.28 |
71.57 |
-3.29 |
-4.60% |
|
DAILY PIVOT POINT |
||||||
|
R3 |
R2 |
R1 |
PIVOT |
S1 |
S2 |
S3 |
|
74.52 |
73.14 |
70.71 |
69.33 |
66.90 |
65.52 |
63.09 |
So, that's the explanation of "Technical Daily Analysis: May 4, 2023 – The Fed Raises Interest Rates, Greenback Plunges". Also read our other articles, such as an explanation of how to buy cryptocurrencies, only in the GIC Journal. Don't forget to practice your trading skills by getting the Scalping Ebook and following Live Trading on NFP Live Trading. Make sure, download GIC Mobile Apps on the Google Play Store.