Last:
Last: 
The following are technical daily analysis, March 2, 2023. The data and analysis contained in this newsletter can be used on a wide scale for your trading. However, it is important to note that GICTrade and its data providers are not responsible for your trading results.
So, it's your own responsibility. Before knowing today's technical analysis, immediately register yourself to take part in the GIC Gebyar Prize and get the main prize, namely Mobile Mitshubshi Expander or Vacation Package to Labuan Bajo for 4 days and 3 nights.
In the following, we will inform you about the forecast of price movements in Forex and Commodities which is equipped with the calculation of Pivot points, Resistance and Support levels.
EURUSD
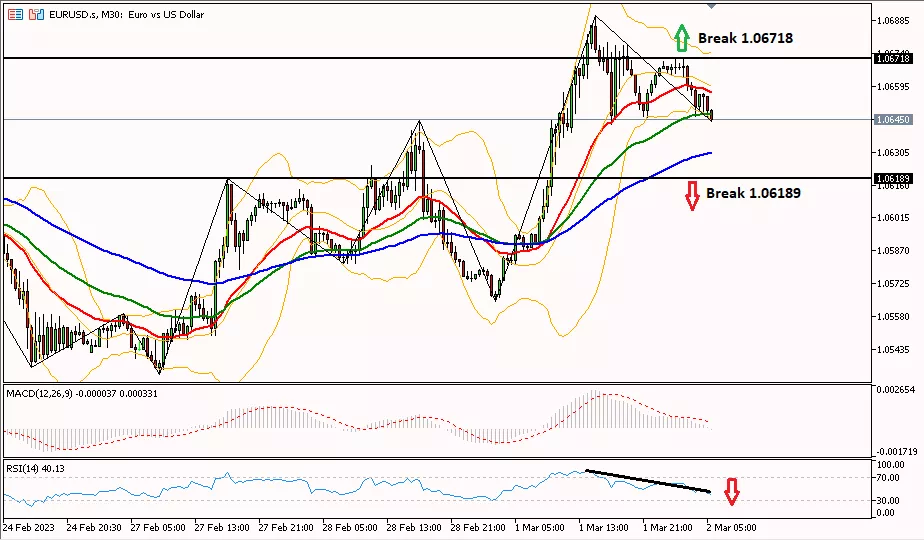
Daily technical analysis for the EUR/USD pair on a 30-minute period moved downwards trying to touch the area of 1.06189 to turn the bias bearish towards the next support at 1.05590. As for further bulls, EUR/USD needs to break through the 1.06718 area towards the next resistance level at 1.07510.
Suggest : Sell 1.06189 TP1 1.05590 TP2 1.04990 SL 1.06718
|
PREVIOUS RANGE |
||||||
|
OPEN |
HIGH |
LOW |
CLOSE |
PREV.CLOSE |
CHANGE |
%CHANGE |
|
1.05747 |
1.06907 |
1.05647 |
1.06683 |
1.05749 |
0.00934 |
0.88% |
|
DAILY PIVOT POINT |
||||||
|
R3 |
R2 |
R1 |
PIVOT |
S1 |
S2 |
S3 |
|
1.08110 |
1.07510 |
1.06850 |
1.06250 |
1.05590 |
1.04990 |
1.04330 |
GBPUSD
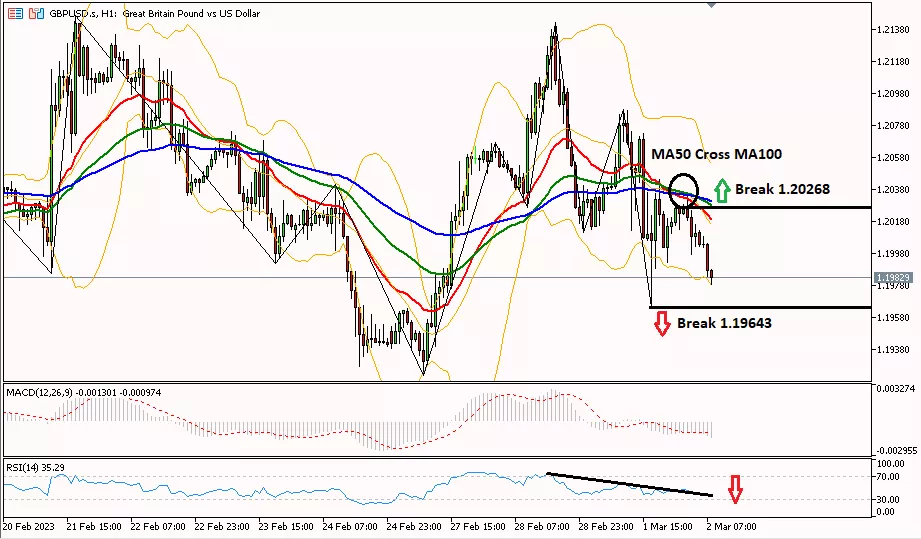
GBP/USD on the 1-hour period moved down, trying to touch the 1.19643 area to turn the bias bearish until the next support at 1.19020. As for further bulls, GBP/USD needs to cross the 1.20268 area towards the next resistance level at 1.20860.
Suggest : Sell 1.19643 TP1 1.19020 TP2 1.18380 SL 1.20268
|
PREVIOUS RANGE |
||||||
|
OPEN |
HIGH |
LOW |
CLOSE |
PREV.CLOSE |
CHANGE |
%CHANGE |
|
1.20217 |
1.20880 |
1.19645 |
1.20262 |
1.20217 |
0.00045 |
0.04% |
|
DAILY PIVOT POINT |
||||||
|
R3 |
R2 |
R1 |
PIVOT |
S1 |
S2 |
S3 |
|
1.22090 |
1.21490 |
1.20860 |
1.20250 |
1.19620 |
1.19020 |
1.18380 |
AUDUSD
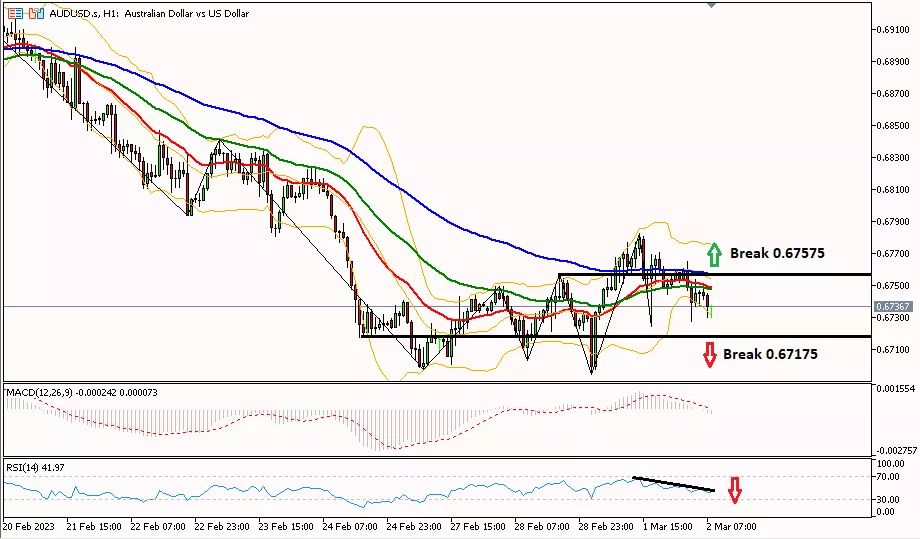
AUD/USD on the 1-hour period moved down, trying to touch the 0.67175 area to change the bias to bearish until it heads towards the next support at 0.66530. As for further bulls, AUD/USD needs to break through the 0.67575 area towards the next resistance level at 0.68300.
Suggest : Sell 0.67175 TP1 0.66800 TP2 0.66530 SL 0.67575
|
PREVIOUS RANGE |
||||||
|
OPEN |
HIGH |
LOW |
CLOSE |
PREV.CLOSE |
CHANGE |
%CHANGE |
|
0.67272 |
0.67828 |
0.66943 |
0.67581 |
0.67280 |
0.00301 |
0.45% |
|
DAILY PIVOT POINT |
||||||
|
R3 |
R2 |
R1 |
PIVOT |
S1 |
S2 |
S3 |
|
0.68760 |
0.68300 |
0.67880 |
0.67410 |
0.66990 |
0.66530 |
0.66110 |
USDCHF
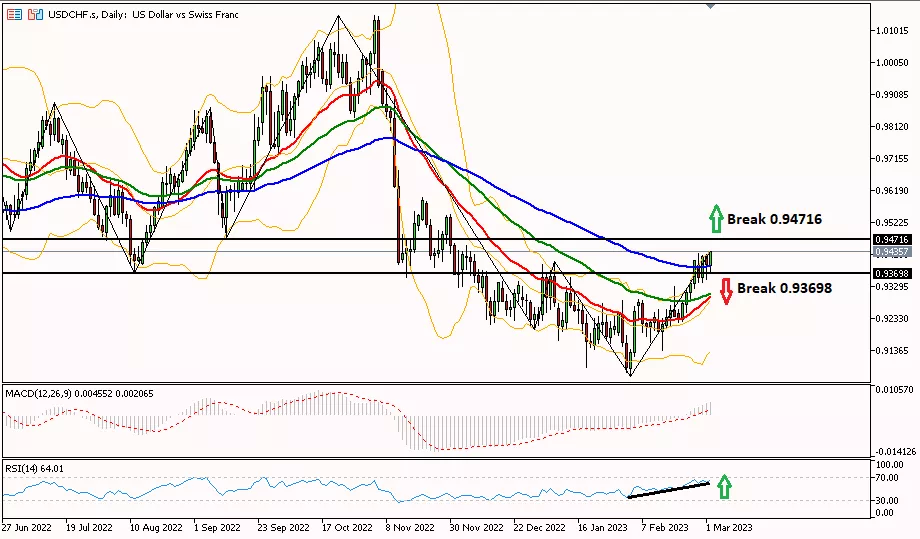
USD/CHF on the daily period rose further testing the resistance area at 0.94716 towards the next resistance at 0.95250. Meanwhile, to turn the bias bearish, USD/CHF needs to pass through the 0.93698 area first, to test the next support at 0.93200.
Suggest : Buy 0.94716 TP1 0.95000 TP2 0.95250 SL 0.94470
|
PREVIOUS RANGE |
||||||
|
OPEN |
HIGH |
LOW |
CLOSE |
PREV.CLOSE |
CHANGE |
%CHANGE |
|
0.94201 |
0.94276 |
0.93494 |
0.93960 |
0.94202 |
-0.00242 |
-0.25% |
|
DAILY PIVOT POINT |
||||||
|
R3 |
R2 |
R1 |
PIVOT |
S1 |
S2 |
S3 |
|
0.95250 |
0.94760 |
0.94470 |
0.93980 |
0.93680 |
0.93200 |
0.92900 |
USDJPY
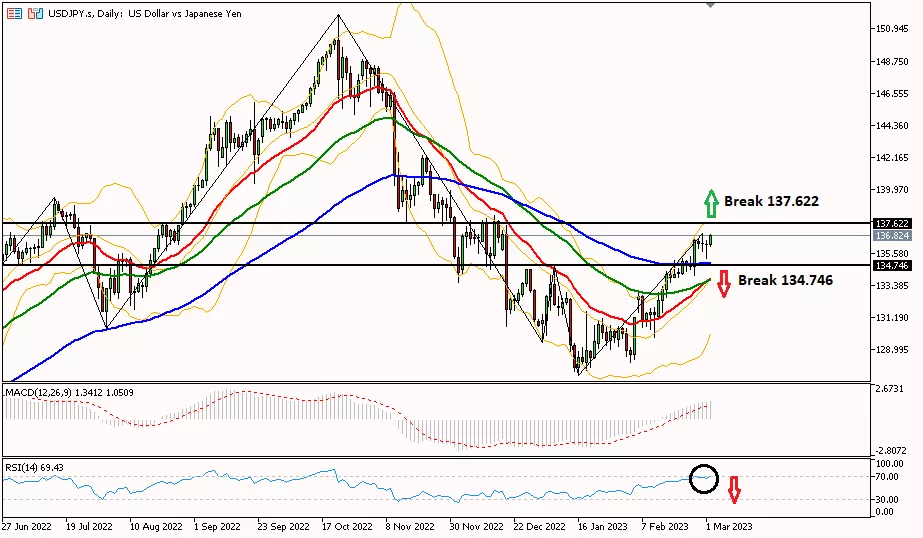
Daily Technical Analysis for the USD/JPY pair on the daily period rose further testing the resistance area at 137.622 towards the next resistance at 138.00. Meanwhile, to turn the bias bearish, USD/JPY needs to cross the 134.746 area first, to test the next support at 134.370.
Suggest : Buy 136.555 TP1 136.810 TP2 137.450 SL 135.915
|
PREVIOUS RANGE |
||||||
|
OPEN |
HIGH |
LOW |
CLOSE |
PREV.CLOSE |
CHANGE |
%CHANGE |
|
136.194 |
136.462 |
135.252 |
136.185 |
136.229 |
-0.044 |
-0.03% |
|
DAILY PIVOT POINT |
||||||
|
R3 |
R2 |
R1 |
PIVOT |
S1 |
S2 |
S3 |
|
138.000 |
137.230 |
136.790 |
136.020 |
135.580 |
134.810 |
134.370 |
XUL (LOCO LONDON GOLD)

Gold prices in the 1-hour period moved a correction testing the 1827.69 support area towards the next support level at 1820.80. Meanwhile, for a bullish bias, the gold price needs to pass the resistance level of 1838.47 back to the next resistance at 1842.30.
Suggest : Sell 1827.69 TP1 1820.80 TP2 1815.00 SL 1832.60
|
PREVIOUS RANGE |
||||||
|
OPEN |
HIGH |
LOW |
CLOSE |
PREV.CLOSE |
CHANGE |
%CHANGE |
|
1825.88 |
1844.40 |
1822.90 |
1837.10 |
1826.95 |
10.15 |
0.56% |
|
DAILY PIVOT POINT |
||||||
|
R3 |
R2 |
R1 |
PIVOT |
S1 |
S2 |
S3 |
|
1863.80 |
1854.10 |
1842.30 |
1832.60 |
1820.80 |
1811.10 |
1799.30 |
CLSK (OIL)
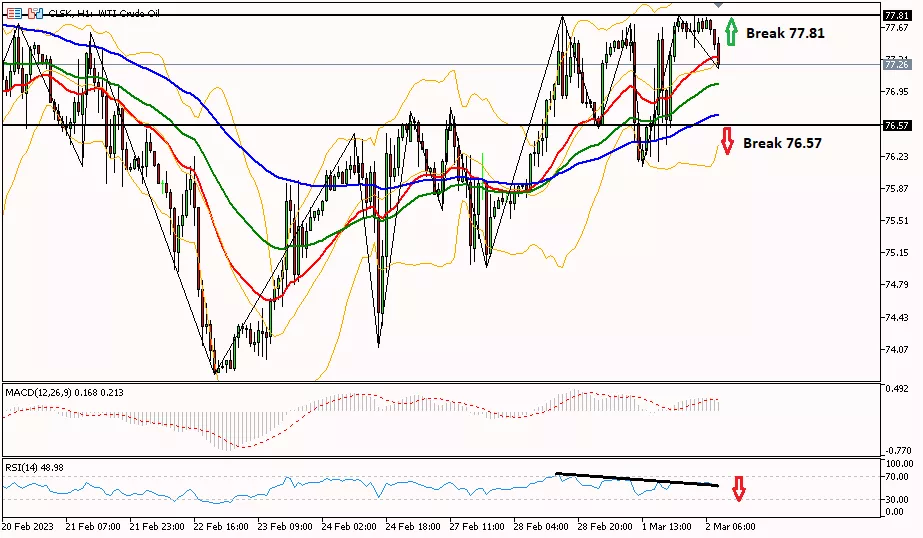
Daily Technical Analysis for oil prices in the 1-hour period moved a correction testing the 76.57 support area towards the next support level at 75.51. Meanwhile, for a bullish bias, oil prices need to cross the resistance level of 77.81 towards the next resistance at 78.89.
Suggest : Buy 76.57 TP1 77.20 TP2 78.28 SL 75.51
|
PREVIOUS RANGE |
||||||
|
OPEN |
HIGH |
LOW |
CLOSE |
PREV.CLOSE |
CHANGE |
%CHANGE |
|
76.83 |
77.81 |
76.12 |
77.66 |
76.84 |
0.82 |
1.07% |
|
DAILY PIVOT POINT |
||||||
|
R3 |
R2 |
R1 |
PIVOT |
S1 |
S2 |
S3 |
|
79.97 |
78.89 |
78.28 |
77.20 |
76.59 |
75.51 |
74.90 |
So, that's the explanation of "Technical Daily Analysis: March 2, 2023 – Greenback Rebound". Also read our other articles, such as an explanation of how to buy cryptocurrencies, only in the GIC Journal. Don't forget to practice your trading skills by getting the Scalping Ebook and following Live Trading on NFP Live Trading. Make sure, download GIC Mobile Apps on the Google Play Store.